
Overview
Feature index
Use these groups to go directly to the workflow you need. The search box filters this guide by any visible term.
Modern foundation
A complete application rewrite
The current TranslatorX beta is a ground-up rewrite of TranslatorX Classic using modern frameworks. It is not a visual reskin: the application has been rebuilt while preserving the detailed protocol analysis and investigation workflows of the original.
The rewrite provides a maintainable cross-platform foundation that supports repeatable quality checks, safer incremental changes, more rapid feature development, and continued expansion without the constraints of the former application framework.
TranslatorX Classic remains available during the beta period. The new application preserves the core trace-analysis workflow while adding the capabilities linked throughout this guide.
First session
Getting started
The public beta is available for macOS and Windows. TranslatorX Classic remains available separately for macOS, Windows, and Linux.
- Install TranslatorX. Choose the current signed package from the download page.
- Open trace data. Drag files or folders onto the opening window, use the Open menu, or import copied text from the clipboard.
- Narrow the message list. Search message content, hide protocols or routine traffic, or create structured filters.
- Follow the call. Open Call Flow for the current display or use Call List to select a CDR call, SIP Call-ID, or correlated SIP session.
- Review warnings. Open View > Event Log when a collection or import reports skipped data, inferred values, or cleanup warnings.
Import
Open traces
Files, folders, archives, and drag and drop
Use File > Open Files for a selected set or File > Open Folder to scan a directory tree. The folder dialog can limit the scan to common trace filenames and selected protocol families. Files and folders can also be dropped anywhere on the opening workspace.
The same detection pipeline handles plain text, gzip-compressed logs, ZIP, TAR, TAR.GZ, and TGZ bundles, supported archives nested up to three levels, packet captures, and normalized .txtrace exports. Unsupported or undecodable entries are reported instead of silently becoming empty messages.
Clipboard text
Choose File > Import from Clipboard after copying console output or a log excerpt. This is useful for CUBE and other command-line output that has not been written to a file.
Append, replace, and complementary sources
When a trace session is already open, Append adds the new data and rebuilds ordering, deduplication, call analysis, and correlation across the complete set. Replace starts a new session. Summary records from Unified CM calllogs can fill gaps when SDL messages are absent; if the matching full SDL message is added later, TranslatorX uses the full message instead of displaying a duplicate summary.
Loading progress
Folder discovery, file inspection, parsing, correlation, and call analysis have separate progress phases. Supported files are parsed concurrently with bounded worker counts so the interface stays responsive and memory usage remains controlled.
Translator window
The message workspace
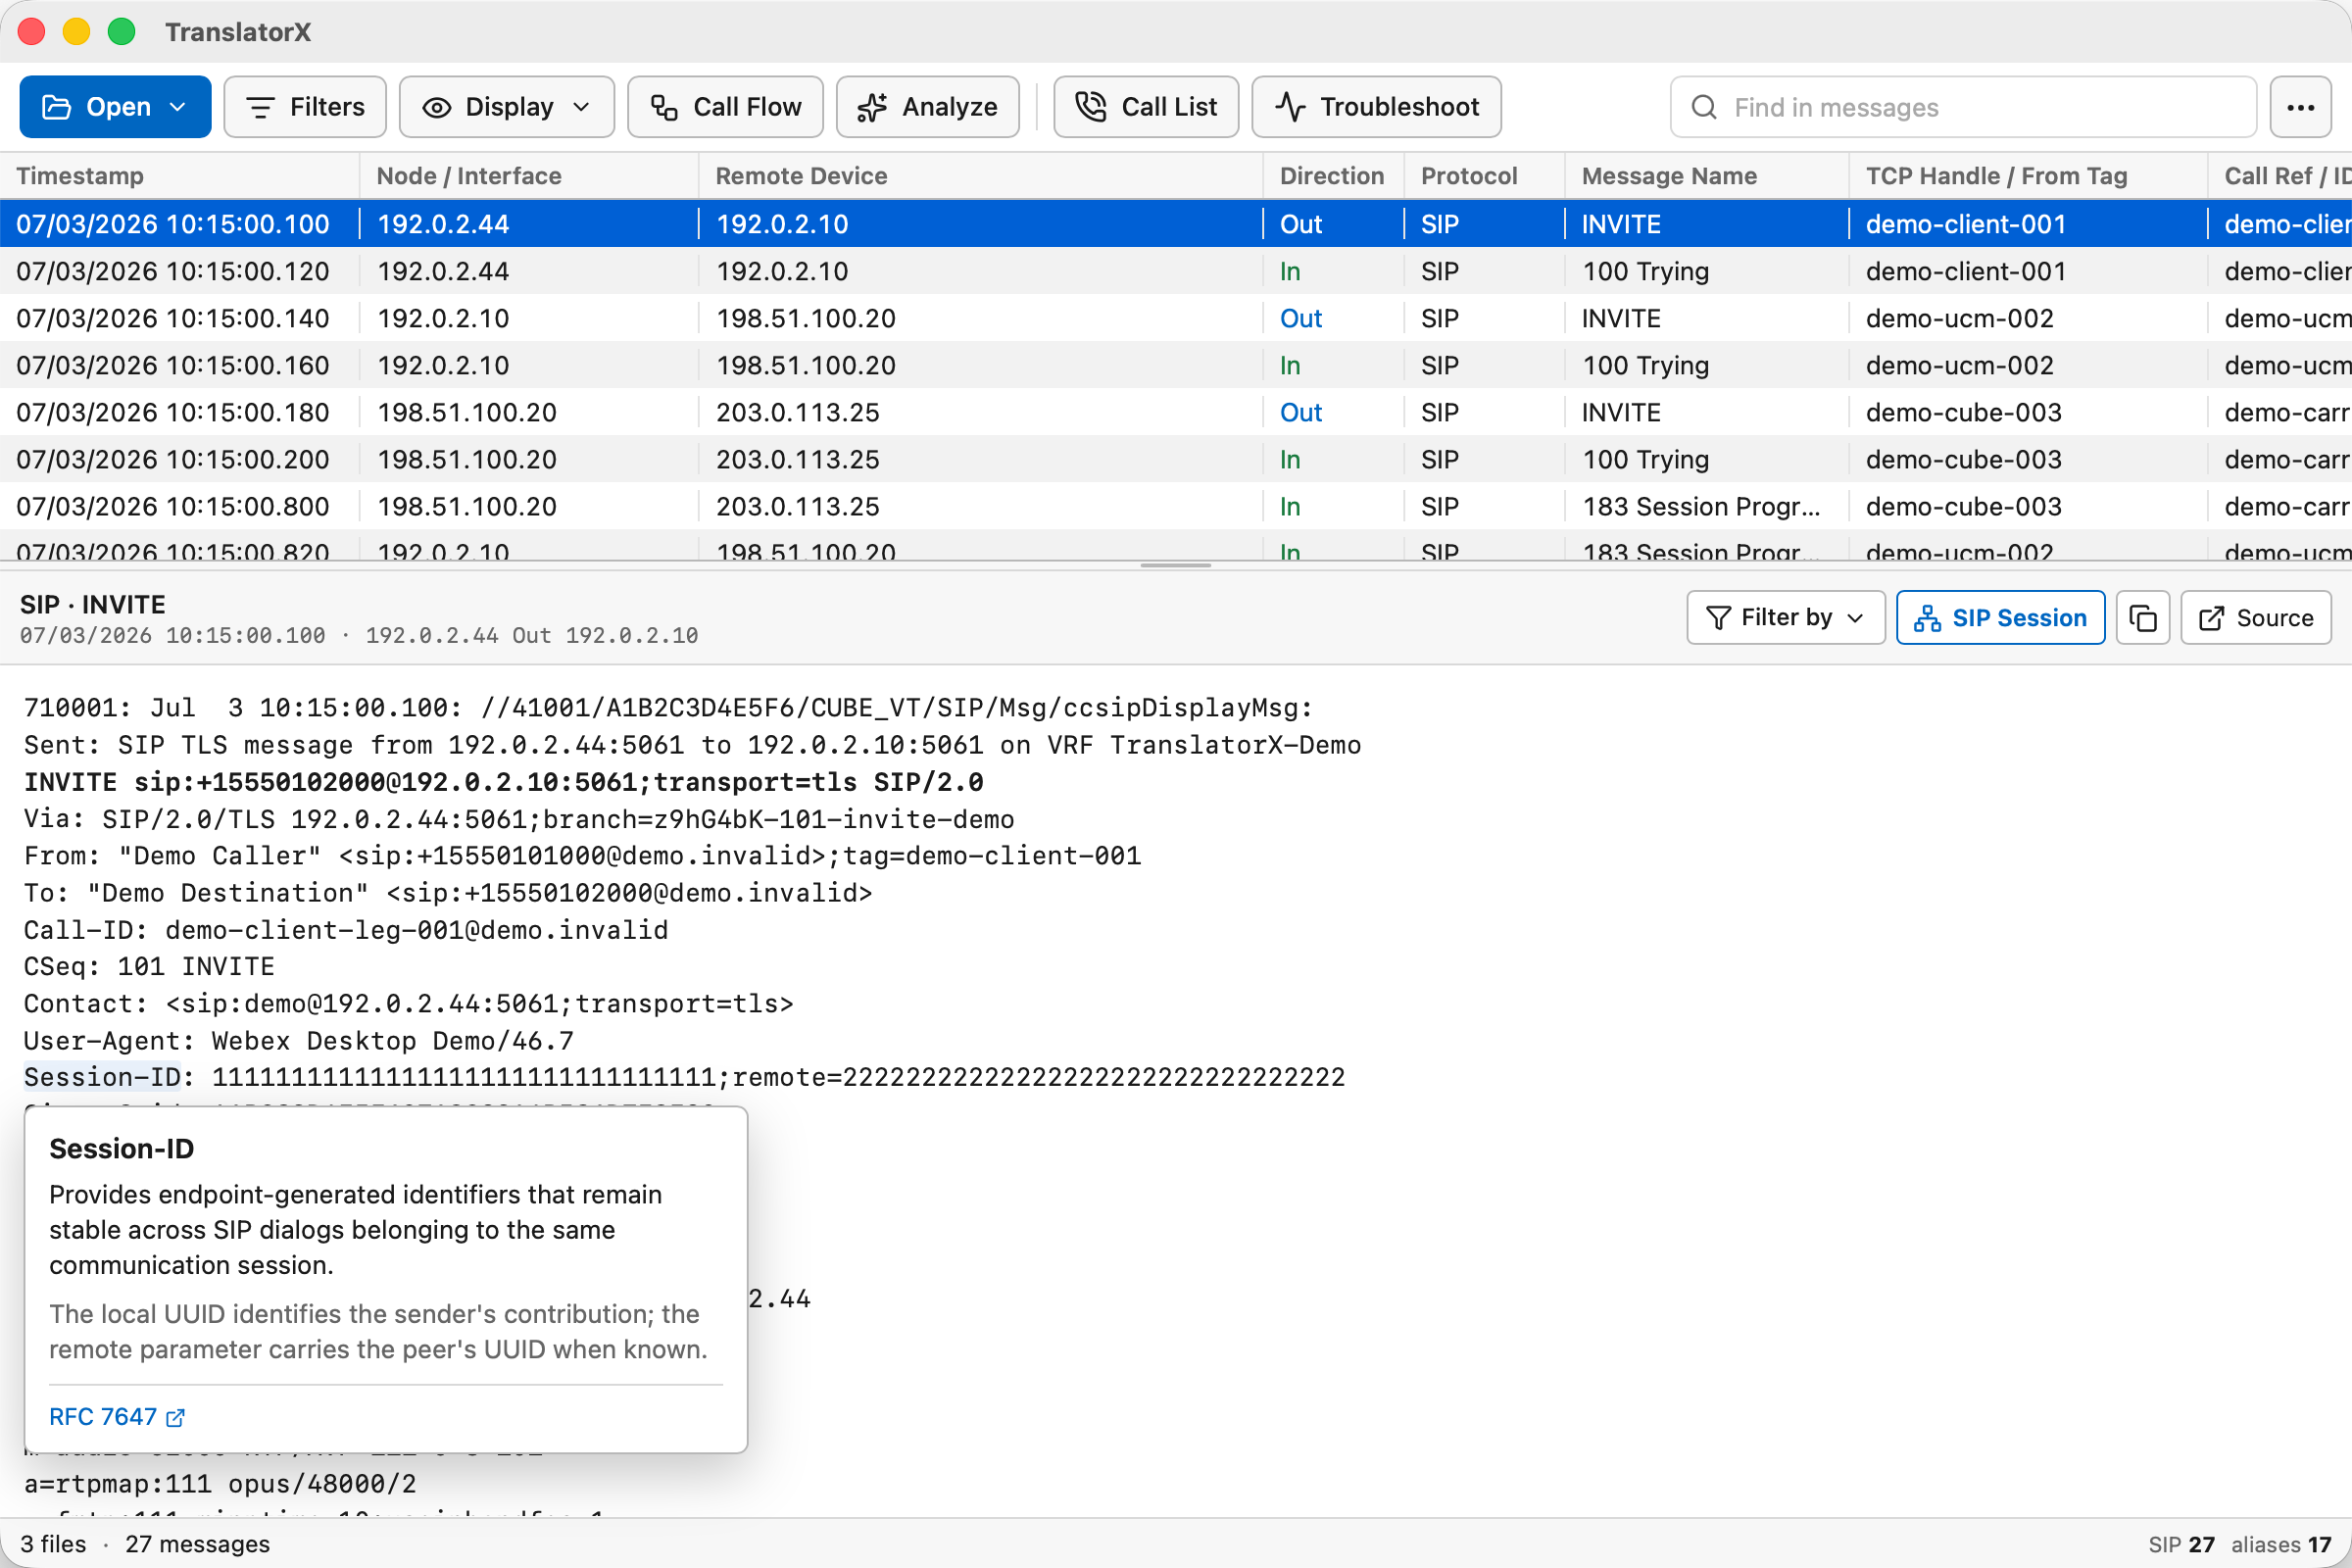
The main table is the chronological view of decoded messages. Columns include normalized time, trace node, remote device, direction, protocol, message name, handle or tag, and call reference or Call-ID. Columns are resizable and can be auto-sized for long hostnames and IPv6 addresses.
Inspect decoded content
Select a row to show its detail below the list. The selection remains attached to that message when search, display controls, or filters reposition it, and becomes visible again if a temporary filter is cleared. SIP and SDP fields include contextual explanations without adding visual underlines to the message text. Use the persistent Help popups control in message details to show or hide those explanations. Q.931, SCCP, MGCP, H.225, H.245, RAS, and other supported protocols are decoded when the source contains enough data. Calllog-only records show a structured summary rather than fabricated SIP content.
SDP help follows each media section as a whole instead of interpreting every line in isolation. Payload numbers are resolved through static assignments and rtpmap, matching fmtp settings are decoded for common audio and video codecs, and the explanations identify preference order, RTP and RTCP ports, transport security, feedback, ICE, BFCP, header extensions, and supported Cisco multistream attributes. Hovering or focusing a payload or another linked SDP value highlights its related lines, making codec parameters, transport settings, candidates, media IDs, and Cisco multistream relationships easier to follow. The displayed message remains byte-for-byte selectable as received.
TranslatorX's SDP interpretation builds in part on SDPlorer, created by Rob Hanton. We thank Rob for sharing the code. TranslatorX adds media-section context, cross-line payload and codec resolution, current standards references, and integration with its SIP and call-flow analysis.
Unified CM SIP normalization
Unified CM SDL traces can include the SIP message before and after a normalization script. TranslatorX keeps the message list wire-accurate by default: inbound rows show what Unified CM received before normalization, while outbound rows show what Unified CM sent after normalization. When semantic content actually changed, an indicator appears after the SIP message name.
Select the indicator or use the message detail control to open the normalization comparison. Inbound messages identify the wire representation as Wire (Before); outbound messages identify it as Wire (After). The Before, After, and Differences views make header, start-line, and body changes visible without adding a duplicate message row. Header ordering, capitalization, compact header names, folded-line formatting, newline style, and trailing blank body lines alone do not count as changes. SDL ...contd... records are reassembled before comparison.
Copy and open source data
Message content is selectable and can be copied. Table labels, controls, timestamps, and addresses are treated as interface elements rather than selection targets. Double-click a message to open its original source at the corresponding line.
Display controls
Use Display to show or hide protocol families and repetitive traffic such as SCCP or MGCP keepalives, SIP REGISTER, OPTIONS, and SUBSCRIBE/NOTIFY/PUBLISH. A checked routine-traffic item is shown. Multi-VRF CUBE traces add a searchable VRF selector that can show any combination of detected VRFs and messages with no VRF value. Display controls continue to apply to new live messages and do not discard messages from the loaded session.
Narrow the trace
Filters and search
The toolbar search performs a case-insensitive text search across message data. Literal matching is the default; switch the search control to regular-expression mode for bounded pattern matching. The same mode is available in the original source viewer and Call List, while invalid or overly complex expressions remain visible as errors and do not replace the current result. Message Filters provide structured criteria for protocol, direction, message, node, endpoint, TCP handle, tags, Call-ID, Session-ID, call reference, correlation value, text, and time.
How filter rows combine
Criteria on one row are combined with AND. Separate rows are combined with OR. A message is visible when it satisfies every populated criterion on at least one row.
Quick and session filters
Select a message and use the Filter menu or detail actions to build a filter from its fields. Filtering a SIP session expands to the Call-IDs in the same explicit correlation component, so the Call List and message filter use the same relationship.
Enable, save, and reuse
Turn Filters enabled off to inspect the unfiltered session without deleting filter rows. Filter sets can be loaded from or saved to .txf files. Search, display controls, and filters continue to apply while live messages are arriving.
Original context
Source viewer
The source viewer opens the original file in a separate window and moves to the selected message.
- Line numbers are enabled by default and can be hidden without changing the file.
- Literal or regular-expression search moves to the first match and provides previous and next controls.
- Matches only hides nonmatching lines until the option is turned off.
- Copying across lines excludes the line-number gutter.
Ordering
Source time and timezone alignment
TranslatorX sorts the combined session by normalized GMT. It uses explicit UTC offsets, timezone text, protocol timestamps, device identity, and matching SIP messages across sources to estimate each file or device clock. Missing years are inferred from the imported session before falling back to the current year.
Open View > Source Times to review the offset, year, confidence evidence, files, and devices assigned to each source. Applying an override re-sorts the messages and rebuilds call and session analysis. The fallback GMT offset in Preferences is used only when stronger evidence is unavailable.
Cisco phone PRT analysis
Endpoint Diagnostics Beta
Endpoint Diagnostics currently supports Problem Report Tool (PRT) bundles from Cisco phones registered to Webex Calling. Load a supported PRT archive or decompressed PRT folder, then open Endpoint Diagnostics. Thank you to Luis Ramirez for contributing to the Endpoint Diagnostics feature.
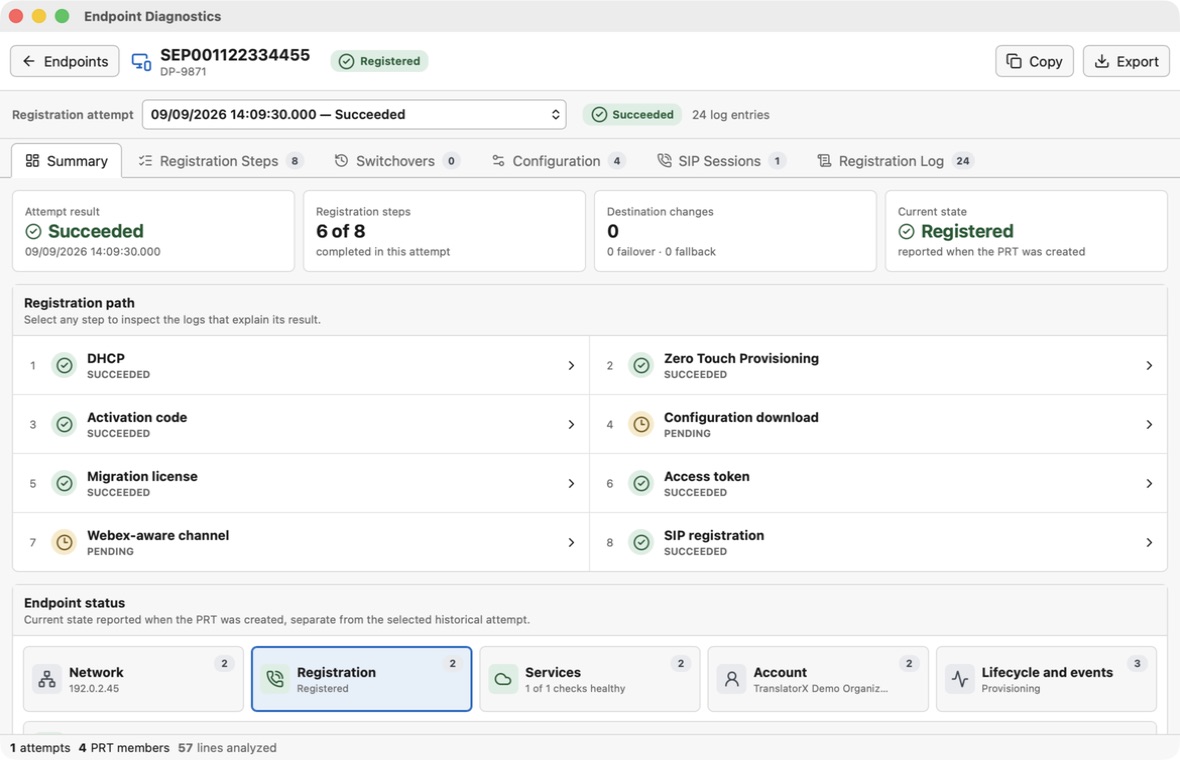
The overview separates current device state from historical registration attempts. Select an attempt to follow DHCP, activation, zero-touch provisioning, configuration retrieval, migration licensing when applicable, identity and service connectivity, and SIP registration. A stage reports only what the PRT supports; missing, ambiguous, or incomplete activity remains explicit instead of being treated as success.
Inspect the supporting source
Stage explanations, findings, and protocol activity link back to exact lines in the active PRT. TranslatorX reads only bounded ranges from recognized registration logs in the current session. Configuration values that may contain credentials or tokens are hidden, and HTTP evidence omits sensitive request and response values.
DNS, HTTP, and SIP context
When the PRT contains supported records, Endpoint Diagnostics correlates registration activity with DNS resolution, provisioning HTTP exchanges, and SIP registration messages for the same endpoint. Use the protocol controls to focus the activity list without changing the loaded trace.
Ladder diagram
Call Flow and media streams
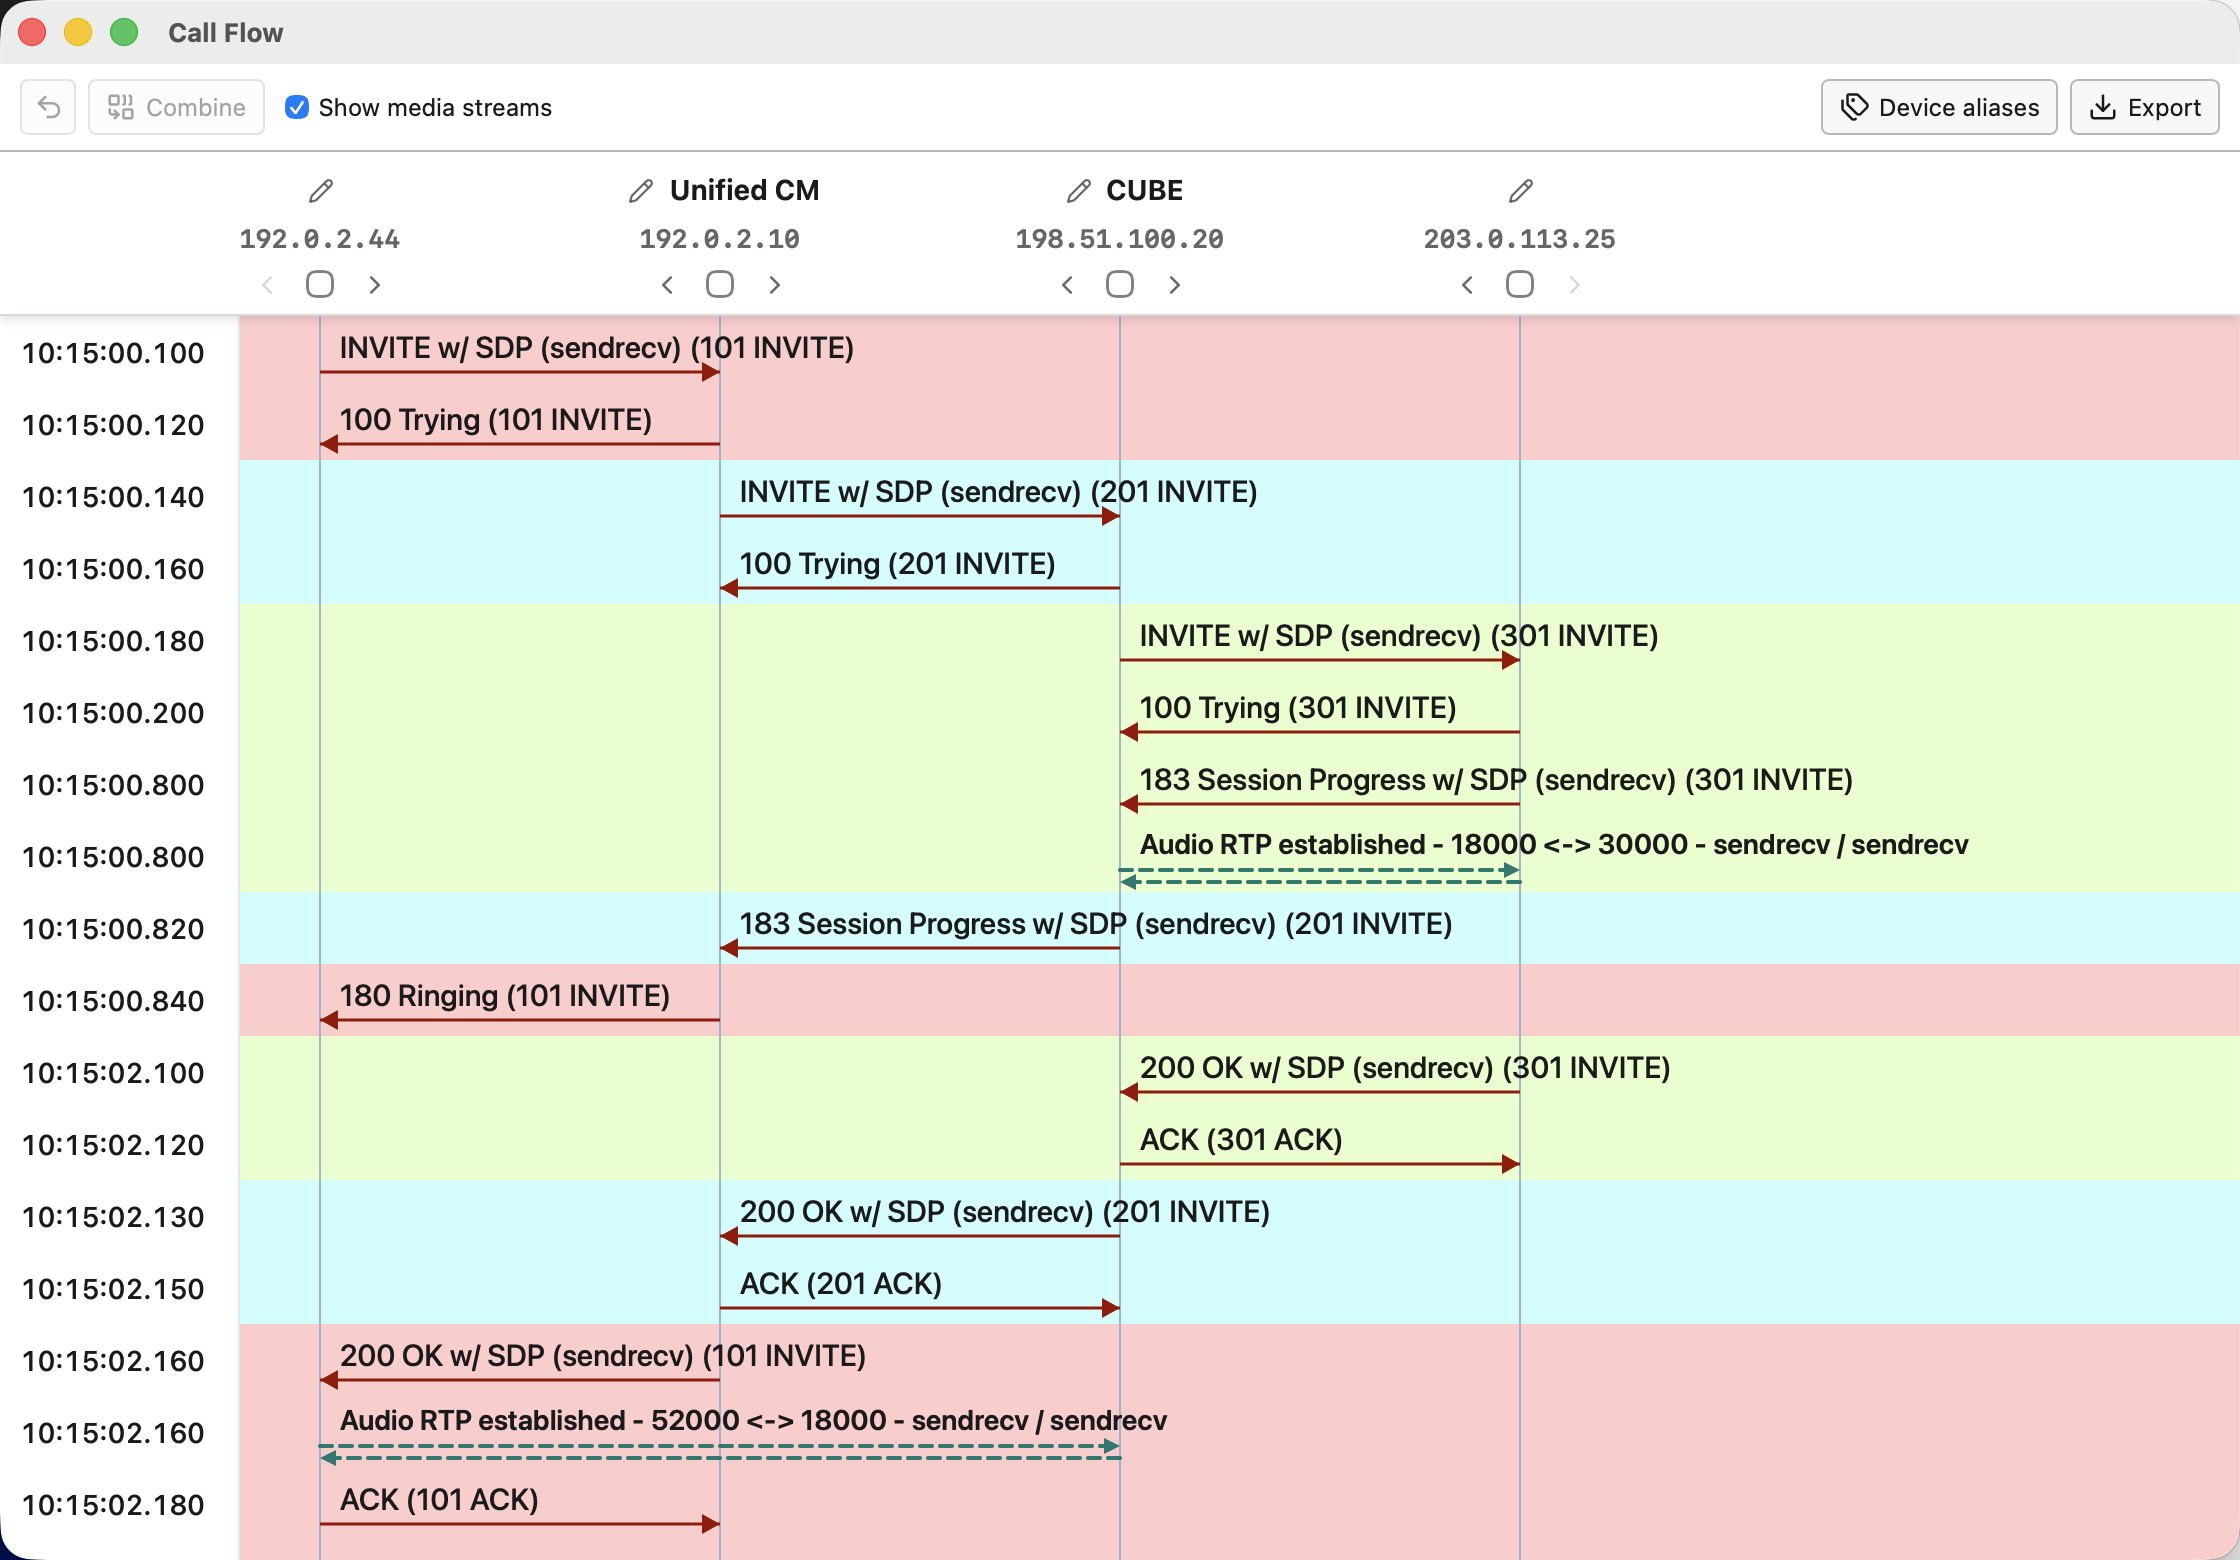
Open Call Flow from the toolbar or View menu. It uses the current search, filter, protocol, and routine-traffic settings and opens in a new window.
Signaling lanes and device aliases
Each lane has an address and a user-editable label. TranslatorX applies the same saved aliases in the main window and every Call Flow window. Reorder lanes with the header controls, or select adjacent lanes and combine them under a standalone label. Media-only addresses are kept adjacent to their related signaling device when the trace provides that relationship.
Message detail and export
Select an arrow to open its message in the resizable side inspector. Closing the inspector clears the selected-row highlight. A SIP BYE arrow includes its Reason and Warning header values when present, making disconnect context visible without opening the message; no annotation is added when those headers are absent. Use Export to save the complete diagram as SVG.
With duplicate SIP suppression enabled, one arrow can represent the same message observed by several devices. An observation-count badge shows how many records are grouped behind the arrow. Use the observation control in message detail to switch among the complete sender, receiver, or other observer perspectives; the timestamp, direction, endpoint and routing context, message text, and source-file link all follow the selected record. Retransmissions remain separate arrows.
Device events from phone PRT files
When selected calls come from a supported phone PRT, Call Flow can place confirmed hook transitions, media-state changes, and DTMF activity in chronological context with signaling and negotiated media. Select an event for its device-side detail and source location. Show device events is enabled by default and remembers the most recent shown or hidden choice; hiding events does not remove SIP messages or media rows.
Negotiated RTP and SRTP
Show media streams is enabled by default, and Call Flow remembers the most recent shown or hidden choice for later diagrams. TranslatorX follows SDP offer/answer exchanges to the original offer endpoint before showing a stream, then displays the negotiated media type and codec, RTP or SRTP transport, addresses, ports, and permitted direction. The codec comes from the format retained by both sides; well-known static RTP payload types remain identifiable when SDP omits an explicit codec mapping. A text-plus-symbol warning appears only when the available evidence indicates poor media; Good and Unknown streams remain undecorated. Re-INVITEs can show inactive, rejected, resumed, or changed media without duplicating an unchanged end-to-end stream. Audio, video, and other SDP media sections are handled through the same negotiation model when both sides are present.
Select a media row to inspect known Good or Bad results and negotiation evidence independently of the SIP message that established it. Unknown or absent quality adds no badge. The inspector places assigned endpoint and CUBE observations under the exact stream direction they measure, keeps only meaningful unassigned evidence separate, compares compatible TX and RX counters, and places each source-report link inside its owning observation. It does not repeat a global source-report list or opaque report IDs. Empty reports and zero-duration/all-zero placeholders are omitted.
RTP evidence
Media quality reports
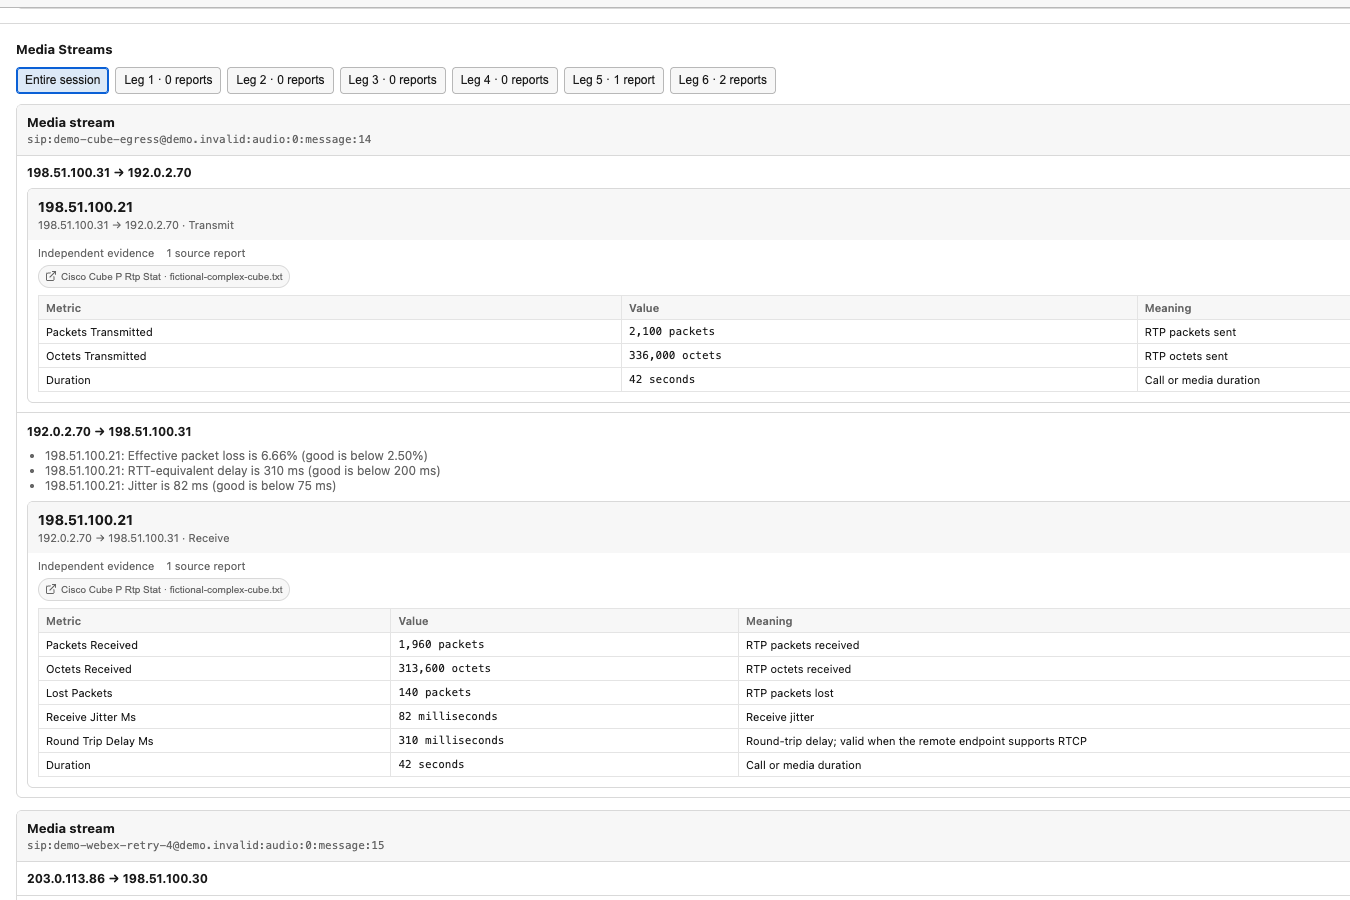
TranslatorX extracts Cisco phone and Webex App RTP-RxStat, RTP-TxStat, RTP-VideoRxStat, and RTP-VideoTxStat headers; CUBE P-RTP-Stat; SIP RFC 6035 vq-rtcpxr bodies; and Unified CM CMR audio and video records. Media Statistics identifies the codec negotiated for an associated SDP stream in addition to any codec reported by the device. Recognized counters, jitter, delay, concealment, codec, bandwidth, frame, MOS, DSCP, network, hardware, and related values use applicable units. Text, identifiers, ratios, and MOS values do not repeat a redundant unit; bit rates use bps. Normalized tables use decoded names such as Duration and Packets Received; original vendor keys, invalid values, and unknown extensions remain visible in raw detail.
Several reports for one stream
A source representation is one literal SIP header, RFC 6035 body, or CMR row. An observation is one device measurement over one counter interval, and a viewpoint identifies its reporter, measurement point, direction, call leg, and interval. TranslatorX combines representations only when exact lineage proves that a SIP report and CMR record describe the same observation. Similar values or timestamps alone never merge reports, and independent endpoint viewpoints remain separate even when they agree.
TX and RX comparison
When an upstream TX report and downstream RX report describe the same directional packet stream, TranslatorX shows TX packets − RX packets, receiver-accounted loss or late packets, the unexplained residual, and nonnegative path-loss percentage. Comparisons are labeled Exact, Comparable with caveats, or Not comparable. Sampling skew, hold/resume, media-changing re-INVITEs, counter resets, transcoders, conferences, media termination, and CUBE anchoring boundaries are disclosed instead of being forced into a misleading loss result.
Assessment profiles
| Evidence | Good loss | Good RTT or equivalent | Good maximum jitter |
|---|---|---|---|
| Endpoint/end-to-end | Below 5% | Below 400 ms | Below 150 ms |
| CUBE gateway hop | Below 2.5% | Below 200 ms | Below 75 ms |
One-way delay is doubled to its RTT equivalent for comparison while the reported value stays visible. Zero received packets and octets during a positive active interval is explicit no-media evidence. For reliable Unified CM concealment data, severely concealed seconds ratio is SCS / duration: good is below 20% for calls under 20 seconds and below 3% for longer calls. Every available gradeable impairment metric must pass for a direction to be Good; a bidirectional stream is Good only when both active directions are Good. MOS, codec choice, bitrate, ICE, FEC, and retransmission counts are explanatory and do not set the initial grade.
Browse all evidence
Use Media Streams in SIP Calls to review established streams and meaningful reports tied to that Call-ID, including evidence that could not be assigned uniquely to a negotiated stream. Rejected and never-active SDP sections remain visible in signaling history but are omitted from this collection. The Session Inspector can show the whole session or preserve one call leg's viewpoint. CDR detail lists compact, exactly associated CMR summaries; selecting one opens only that record's complete normalized and raw detail. CDR/CMR association does not imply a Call Flow stream correlation.
Definitions follow Cisco's phone RTP statistics, CUBE end-of-call statistics, and Unified CM CMR guides, plus RFC 6035. TranslatorX does not inspect RTP payloads or guess between equally plausible media sections.
Call List
Calls and SIP sessions
Call summaries are cached while traces load so opening Call List does not repeat the entire analysis. The window has three independent views:
| View | What it represents | Available actions |
|---|---|---|
| CDR Calls | Embedded or standalone Unified CM CDR records. | Inspect CDR fields, filter the trace, open Call Flow, or export. |
| SIP Calls | One trace-derived call per Call-ID with an observed initial INVITE. | Open Call Flow, inspect media quality, filter, open the first INVITE, copy identifiers, or export. |
| SIP Sessions | Visible and partial legs linked by Session-ID, remote-cc, or Cisco-Guid evidence. | Expand legs, filter every related Call-ID, open Call Flow, inspect, or export. |
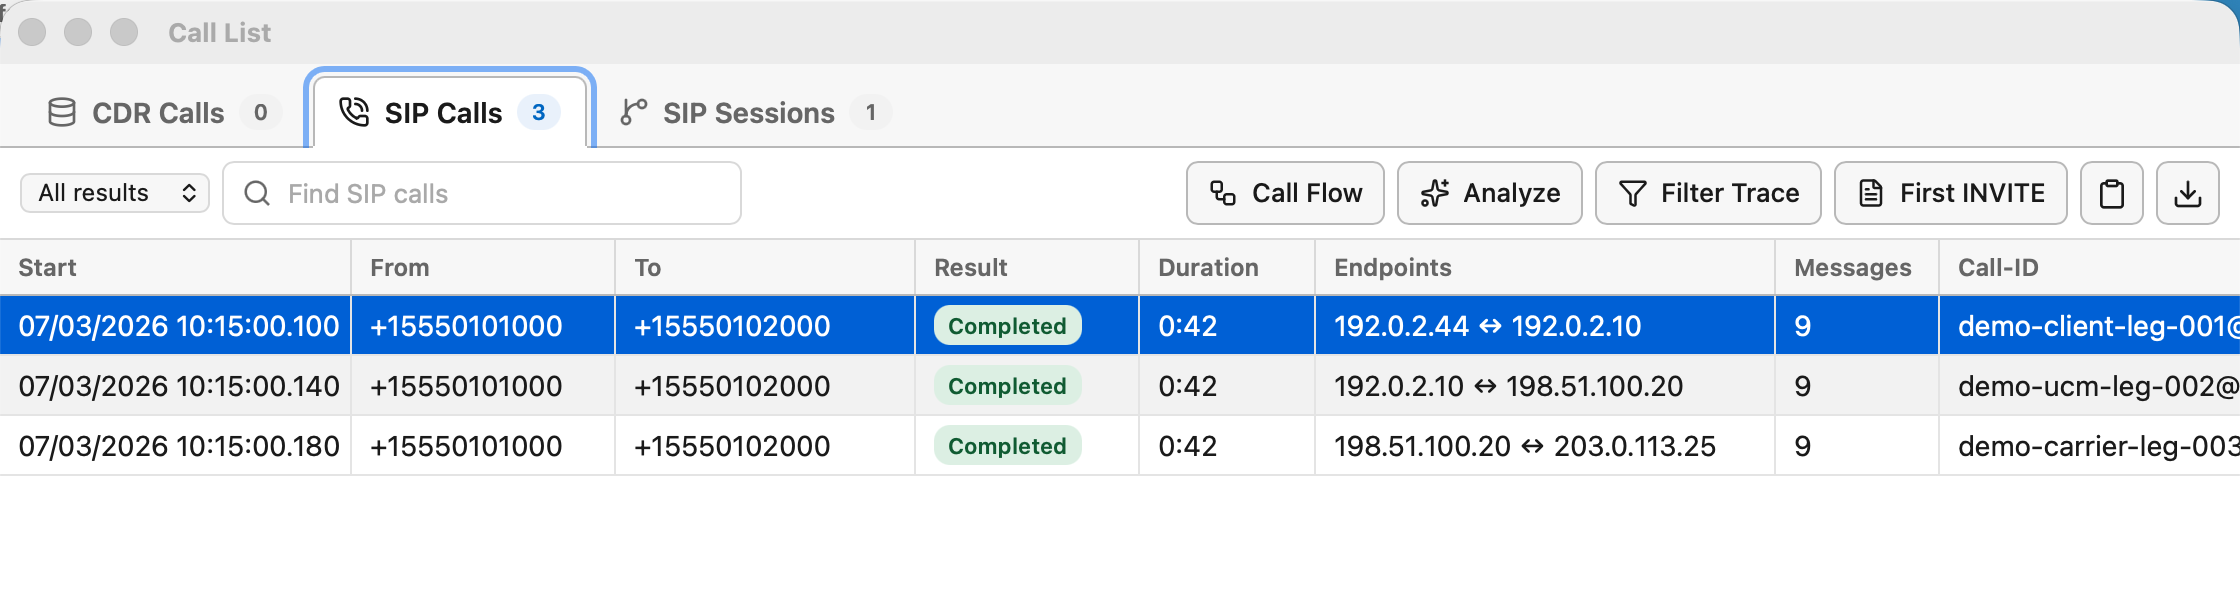
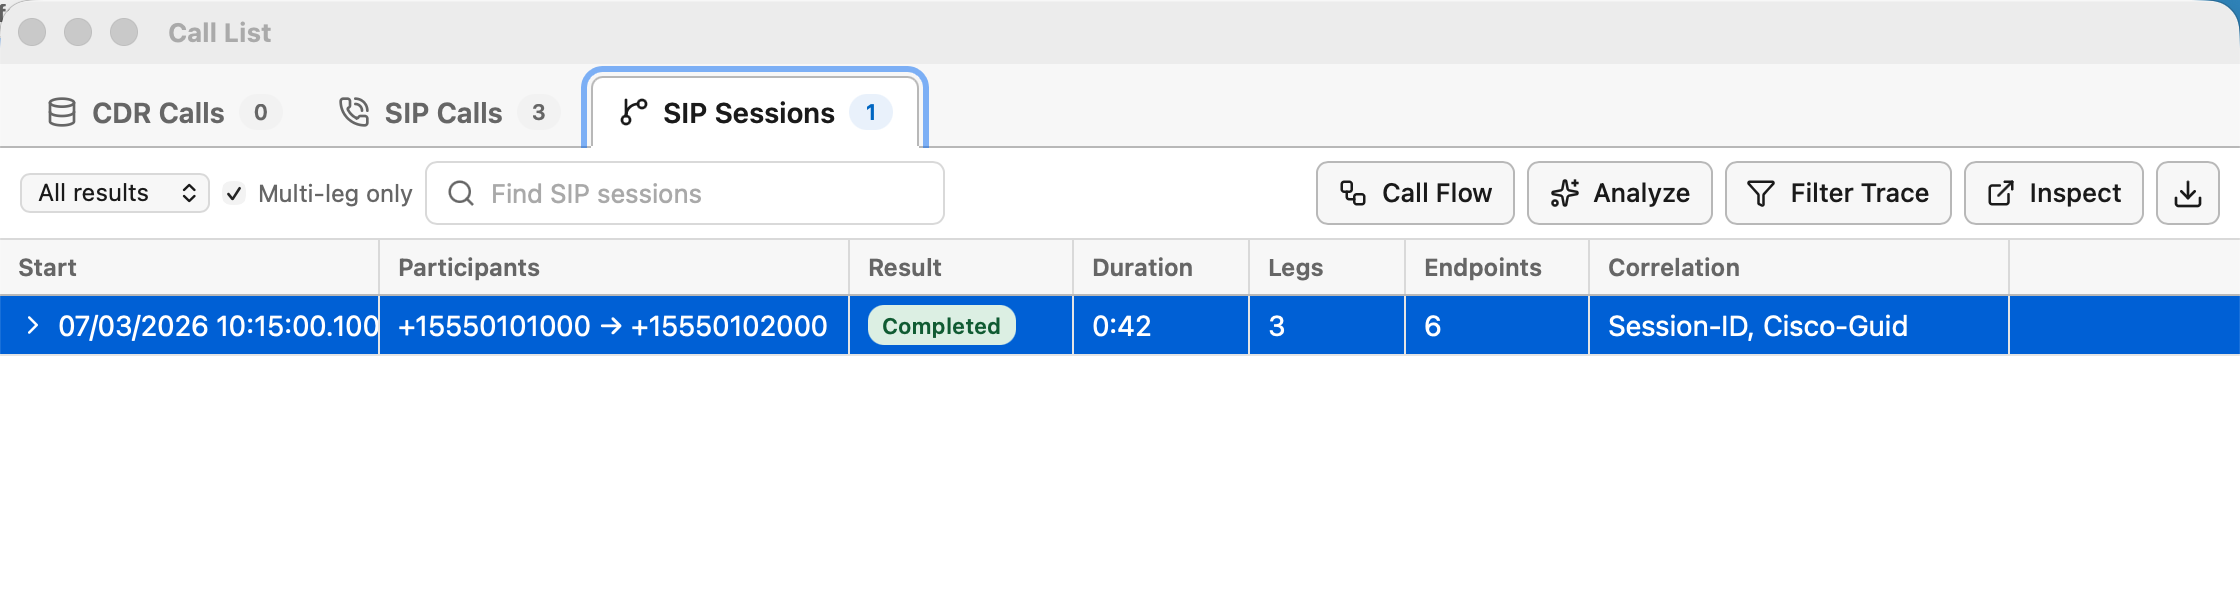
SIP call outcomes distinguish completed, connected, cancelled, redirected, rejected, failed, and incomplete calls. Retransmitted initial INVITEs are collapsed for summary purposes, while unique re-INVITEs and all messages remain available in the trace and Call Flow.
When CUBE trace data identifies matched inbound or outbound dial peers, SIP Calls displays that routing context with the initial INVITE. Multi-VRF CUBE traces add searchable, multi-select VRF controls to SIP Calls and SIP Sessions, including a <none> choice for calls without VRF metadata. Related call legs in another VRF remain visible by default so an end-to-end session is not broken apart; turn off Related sessions across VRFs in the VRF selector to restrict results to direct matches.
Call List search includes participants, signaling endpoints, call outcomes, dial peers, and VRFs from every associated leg, as well as the call and session identifiers shown in the summaries. A search can therefore find a correlated call or session when the matching device or route appears on a different leg.
Select a range with Shift or select noncontiguous rows with the platform modifier key. Copy includes the visible column headings and complete visible cell values for every selected row. Filtering applies all identifiers represented by the selection; Call Flow, First INVITE, Media Streams, Inspect, and other actions that require one row are available only for a single selection. First INVITE reveals the exact decoded request in the main Translator, including when the destination is outside the currently rendered portion of a large message list.
A SIP Session is shown only when its correlation component contains at least one initial-INVITE-backed SIP Call. Partial legs can remain as related context for a visible session, but fragments captured after a call was already established do not create a session row without a corresponding call.
End-to-end session
Session Inspector and observed topology
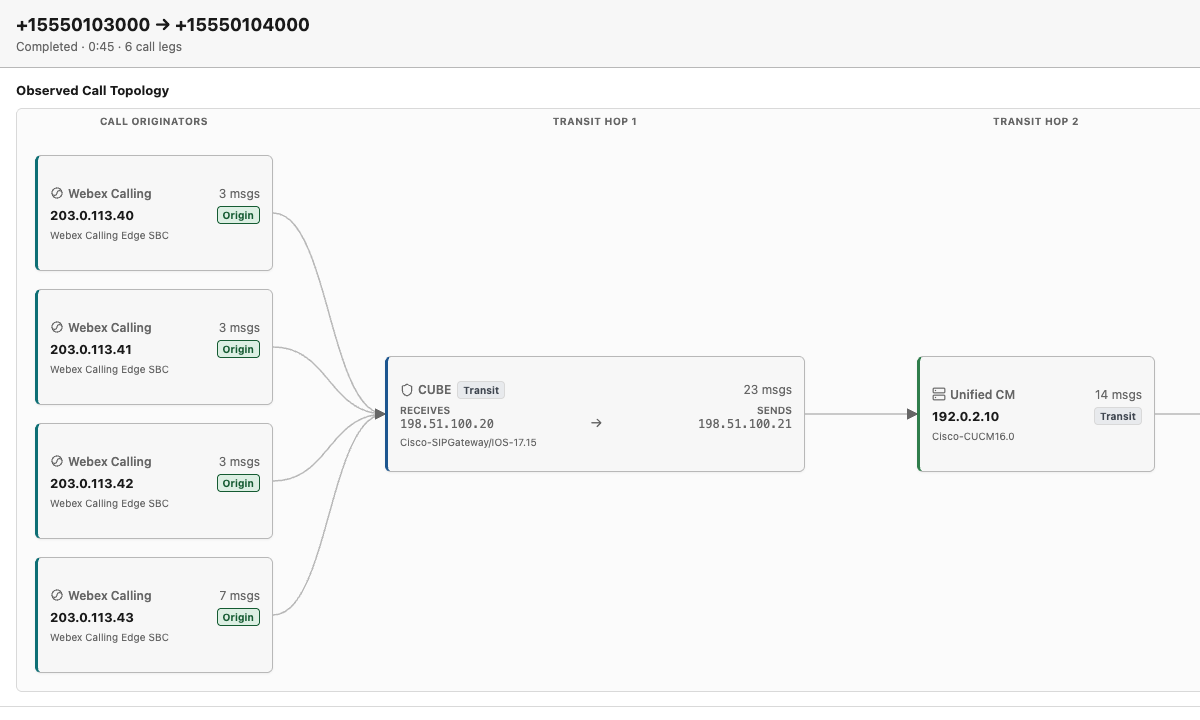
The Session Inspector opens separately and combines the topology, chronological call legs, media evidence, and session timeline for one correlated SIP session.
Follow the call rather than file order
The observed topology follows the direction of each leg's initial INVITE rather than the order in which endpoints were discovered. Call originators start on the left, followed by transit hops, with Call termination on the right. Later responses and in-dialog requests do not reverse the topology.
Forks, retries, redirections, and transfers can create branches or introduce a new endpoint later in the session. TranslatorX draws only observed or strongly inferred relationships; it does not invent a signaling exchange merely to force every endpoint into a single chain.
One device with multiple signaling interfaces
When correlated call legs show the same signaling device receiving on one interface and transmitting on another, TranslatorX presents one wider device card. The left and right sides identify the ingress and egress addresses so the handoff is clear without a false arrow between two copies of the same device.
Device labels
TranslatorX uses the strongest available signaling evidence to label supported device types. When the available evidence is not sufficient, the endpoint remains generic rather than being assigned a guessed identity.
Legs, events, and media
Calls are labeled Leg 1, Leg 2, and so on. Endpoint history, correlation evidence, and timeline events cover initial INVITE, ringing, answer, new legs, transfer evidence, failure, and disconnect. Timeline events use TranslatorX's normalized source-time view rather than raw epoch values. The Media Streams area can show the whole session or preserve one selected leg's viewpoint, including the normalized and raw quality reports described above.
Summary records
CDR, CMR, and Unified CM calllogs
CDR and CMR data can be embedded in traces or opened from supported standalone files. When Unified CM exports CDR and CMR separately, open the CDR first and use Load CMR data in CDR detail to attach the corresponding CMR file. The detail window provides organized field groups, a raw field view, field search, and a compact list of every exactly associated CMR. Each list item shows its endpoint or call leg, timestamp, media type, duration, and brief status; select one to open that CMR's complete detail instead of placing every record in one crowded CDR view. Missing CMR input is distinguished from loaded data with no exact match.
Unified CM calllogs contain high-level SIP events but not complete wire messages. TranslatorX decodes the available event fields, endpoints, identifiers, direction, and status into a readable summary. These records participate in ordering and correlation and fill missing SDL events. A matching full SDL message takes precedence when both sources are loaded.
Reusable access
Profiles and secure connections
Open Profile Manager from the More menu or Preferences > Connections to add, edit, test, and remove Unified CM, CUBE, and Expressway profiles. Collection screens can create or update the same profiles, so there is one shared profile list throughout the application.
| Profile | Connection | Used by |
|---|---|---|
| Unified CM | Publisher hostname or address, Serviceability API credentials, and an optional HTTP or SOCKS5 proxy. Cluster nodes are discovered automatically. | Single-device, multi-device, and troubleshooting collection. |
| CUBE | SSH with an optional enable password, jump host, and SOCKS5 proxy. | Historical VoIP trace, multi-device and troubleshooting collection, and live trace. |
| Expressway | SSH for Network Log access and HTTPS for diagnostic capture operations; optional jump host and SOCKS5 routing for SSH, plus HTTP or SOCKS5 routing for HTTPS. | Historical Network Log, multi-device and troubleshooting collection, diagnostic bundles, and live trace. |
Create and verify a profile
- Choose the product. Add a Unified CM, CUBE, or Expressway profile from Profile Manager or the relevant collection screen.
- Enter the connection route. Supply the product address and port. For SSH products, leave SSH Route set to Direct or select a configured jump host, then optionally select a SOCKS5 proxy. For Unified CM or Expressway HTTPS, use the system proxy, connect directly, or select one saved HTTP or SOCKS5 profile.
- Choose authentication. Configure the end device credentials independently from any jump-host credentials.
- Test the connection. Confirm reachability, host or certificate trust, authentication, and product-specific prerequisites before relying on the profile during an incident.
- Save the profile. The same saved profile becomes available to single-device, multi-device, troubleshooting, and supported live workflows.
Credential storage
Passwords, API keys, key passphrases, proxy passwords, and optional CUBE enable passwords are stored in the operating system credential manager when saving is requested. Profile metadata does not contain the secret value.
When a CUBE needs an enable password, TranslatorX accepts password-style prompts customized by an AAA policy, such as AD Password:. Unrelated privilege challenges are not answered with the saved enable password.
Proxy profiles
Open Proxy Profiles from the application menu or Preferences > Connections to create reusable HTTP and SOCKS5 routes. Choose the type and enter the proxy host name or IP address and port separately. A username and password are optional; leave both blank when the proxy does not require authentication. When credentials are supplied, only the password is placed in the operating system credential manager.
Unified CM, Expressway HTTPS, and software updates each use exactly one route: System proxy uses the operating system configuration, Direct connection explicitly bypasses proxies, and a named HTTP or SOCKS5 profile uses that custom proxy. HTTP profiles use CONNECT for HTTPS destinations. SOCKS5 profiles resolve the destination name through the proxy and can route both supported HTTPS connections and CUBE or Expressway SSH. For SSH, the SOCKS5 route reaches either the device directly or its selected jump host.
TranslatorX continues to validate the real destination certificate or SSH host key through either proxy type. If the proxy itself cannot be reached, the connection result identifies the proxy type and endpoint and confirms that no destination certificate was received and no product credentials were sent.
A proxy profile cannot be deleted while any saved Unified CM, CUBE, or Expressway profile still selects it. TranslatorX identifies every profile using the proxy so its route can be changed first. Update-proxy selections are cleared or changed from Preferences.
SSH authentication
CUBE and Expressway connections apply a consistent SSH security policy across supported macOS and Windows releases while supporting a wider range of current key exchange, host-key, and cipher algorithms. TranslatorX prefers supported hybrid post-quantum key exchange and excludes legacy key exchange, host-key signatures, ciphers, and message authentication algorithms. A completed test lists what each host actually negotiated; a classical key exchange is identified when the device does not support a permitted hybrid method.
Connections support passwords, OpenSSH private keys, FIDO2 *_sk keys backed by a hardware authenticator, and keyboard-interactive authentication. Production OpenSSH packages for macOS, Windows, and Linux include the FIDO2 provider and helper required by security-key private keys. TranslatorX prompts only when the server requests interactive input or user presence. Optional jump hosts use an independently configured username and authentication method. New SSH host keys must be reviewed before they are added to known_hosts. A known identity remains valid when another key type already stored for that host is negotiated, but an unrecognized replacement for a trusted key is rejected.
Jump hosts
Open SSH Jump Hosts from the More menu or Preferences > Connections. Each jump host has its own address, username, authentication method, saved secret, and host-key trust. Test the jump host by itself before assigning it to a CUBE or Expressway profile.
- Add and test the jump host. Complete any password, private-key, security-key, or keyboard-interactive MFA flow required by the intermediate host.
- Select it on the device profile. Change SSH Route from Direct to the saved jump host. End-device credentials remain separate.
- Test the complete route. TranslatorX authenticates to the jump host, opens the forwarded connection, then independently verifies and authenticates to the destination device.
HTTPS certificate review
Supported HTTPS APIs require TLS 1.2 or newer. If platform certificate validation fails, TranslatorX shows the certificate subject, issuer, validity, and SHA-256 fingerprint before credentials or trace evidence are sent. Accepting it stores an exact certificate pin for that origin. A changed certificate requires another review.
Test before collection
Use Test on a profile or jump host to verify network reachability and authentication. A progress dialog appears immediately and is replaced by the complete result. SSH results show the key exchange, host-key algorithm, and both traffic-direction cipher details for each host. CUBE tests also inspect privilege access, VoIP Trace state, and live-trace logging-buffer readiness. When privileges permit, TranslatorX can prepare an insufficient logging buffer and optionally save those logging changes to startup configuration. If the CLI session or readiness command fails, the result reports an unknown logging state or connection failure and does not present the device as a configuration problem.
Historical logs
Single-device historical collection
Choose this workflow when the incident already happened and one product is the intended evidence source. Collection uses the configured download directory and accepts either a relative duration or an absolute start and end time. Successful results are imported automatically.
| Mode | Time model | Targets | What it changes |
|---|---|---|---|
| Single-device | Relative duration or absolute start and end. | One saved profile. Unified CM includes discovered cluster nodes. | Reads available historical data; CUBE can offer to enable VoIP trace if required. |
| Multi-device | One relative or absolute interval shared by every selected profile. | Multiple Unified CM, CUBE, and Expressway profiles. | Runs the product collectors in parallel and combines the results. |
| Troubleshooting session | Start now, reproduce, then stop. | Multiple Unified CM, CUBE, and Expressway profiles. | Records the exact interval and coordinates Expressway diagnostic logging. |
| Live collection | Continuous until stopped. | One or more CUBE and Expressway profiles. | Enables required CUBE debugs and continuously polls or streams new signaling. |
Run a single-device collection
- Select the product and profile. Create or update the connection in place if it is not already saved.
- Choose the interval. Use a relative duration such as the last 60 minutes, or enter an absolute start and end time.
- Choose the import boundary. Load only messages within this time range is enabled by default. TranslatorX normalizes source clocks, then discards messages outside the selected interval before call reconciliation, correlation, Call List, or Call Flow analysis. Clear the option only when you want to import the full contents of every downloaded file.
- Confirm the download directory. TranslatorX keeps downloaded source data there and imports supported results into the current workspace.
- Start collection. Follow product-specific prompts for certificate or host-key trust, MFA, CUBE privilege, or VoIP trace prerequisites.
- Review results. Successful messages load automatically. Open Event Log for skipped files, inferred clocks, partial results, or device-specific warnings.
Unified CM
Provide the publisher address and Serviceability credentials. TranslatorX discovers the cluster and collects Cisco CallManager service traces from the available CallManager nodes for the requested timeframe without requiring individual service or filename selection. If a node is unavailable, TranslatorX skips it, continues with reachable nodes, and opens Event Log with a warning. IM and Presence nodes that do not provide Cisco CallManager traces are not collection targets.
CUBE
Historical CUBE collection reads show clock and show voip trace cover-buffers, interprets the cover-buffer entries in the device’s local time and timezone, selects calls in the requested interval, and retrieves each call with show voip trace call-id. Large results are grouped into sequential trace batches without splitting an individual call, and every successful batch is imported automatically. TranslatorX checks show voip trace statistics; if VoIP trace is disabled, it can ask for permission to enable it before collection. An optional enable password can be used when the login does not begin at privilege level 15.
Expressway
TranslatorX can poll the persistent Network Log over SSH for a requested timeframe. Detailed network.sip records include full SIP messages when debug logging is enabled; INFO-level summaries can still provide limited call events when message bodies are unavailable. Diagnostic logging status is read before start or stop actions, and completed bundles are downloaded and imported. Modern and older Expressway trace layouts retain separate compatibility paths.
Multiple products
Multi-device collection and troubleshooting sessions
Both workflows combine evidence from several products. Use Multi-Device Collection for an interval that already exists; use a Troubleshooting Session when you are ready to reproduce the issue now.
Multi-Device Collection
- Select saved profiles. Choose any combination of Unified CM, CUBE, and Expressway connections.
- Set one timeframe. The same relative duration or absolute interval is applied to every selected profile.
- Collect in parallel. Bounded concurrency prevents one slow target from blocking unrelated devices. The status view reports each profile independently.
- Review the combined trace. Results are imported together so source-time alignment, deduplication, call analysis, and session correlation can operate across products.
Troubleshooting Session
- Select participating profiles. Profiles can also be created from the troubleshooting screen.
- Start the session. TranslatorX records the start time and starts the required Expressway diagnostic capture. If a prior Expressway capture is active, it is stopped before the new one begins.
- Reproduce the problem. Keep the session limited to the time needed to capture the behavior.
- Stop and collect. TranslatorX records the end time, stops managed capture state, collects every selected product for that exact interval, and imports the results together.
Warnings from one target do not replace successful results from the others. Open Event Log for per-device collection, authentication, clock, and cleanup details.
Real-time signaling
Live CUBE and Expressway traces
Start one or more CUBE and Expressway profiles together or add another source while a trace is already running. New messages are appended to the workspace and immediately participate in search, filters, call analysis, and open Call Flow windows.
CUBE live trace
CUBE uses debug ccsip messages and SIP transport data over one SSH session. Instead of depending on terminal-monitor delivery, TranslatorX reads new sequenced records from the IOS logging buffer every five seconds. Each poll resumes after the last captured record marker, and stopping the trace triggers one final read before the parser is flushed. TranslatorX retains VRF names reported with sent and received SIP messages and gathers matching interface, socket, and transport context to improve source and destination addressing where standard SIP debug output does not contain it. Multiple CUBEs can run simultaneously.
CUBE logging-buffer readiness
Live tracing requires buffered logging at debugging level, a buffer of at least 10 MB, service sequence-numbers, and no logging-buffer filters. If the device is reachable but not ready, the live trace pauses on its existing SSH session and shows the state of every requirement. Prepare & Continue enables sequence numbers and sets buffered logging to debugging without reducing a larger existing buffer. Remove any configured logging-buffer filters on the device; TranslatorX does not automatically delete filter configuration.
Preparation changes the running configuration. Select Save changes to startup configuration to run write memory after verification. When a saved CUBE profile is in use, the choice can also be remembered so future live traces prepare the device automatically. TranslatorX does not restore the prior buffer settings when the trace stops. A failed connection or an unreadable logging state is shown as a connection/readiness failure and never offers Prepare & Continue without a confirmed device state.
Slow links, buffer capacity, and CPS
Only one logging-buffer command can be active for a CUBE. If a read lasts beyond the next five-second boundary, TranslatorX skips that elapsed poll and schedules the next one from the last captured record marker. Polls never overlap. IOS can interleave VoIP Trace cover buffers whose sequence ranges and timestamps differ from the ordinary logging stream; TranslatorX retains those records in physical buffer order. If the buffer wraps or is cleared and the last marker is no longer present during a full verification read, TranslatorX stops with an explicit gap error instead of presenting an incomplete trace as reliable.
The 10 MB minimum is a safety floor, not a guaranteed calls-per-second rating. Estimate capacity with CPS = buffer bytes / (average debug bytes per call × desired retention seconds). Designing 10 MB to hold 10 seconds permits about 1 MB/s of total buffered logging. The following examples use decimal units and assume calls are the only buffered traffic:
| Average debug data per call | Approximate CPS for 10 seconds in 10 MB | Minimum sustained payload retrieval |
|---|---|---|
| 25 KB | 40 CPS | 8 Mb/s |
| 50 KB | 20 CPS | 8 Mb/s |
| 100 KB | 10 CPS | 8 Mb/s |
Call complexity, retransmissions, other syslog traffic, SSH framing, and command output increase the real requirement. Measure representative traffic on the target CUBE, choose a larger buffer when needed, and plan network capacity above the calculated payload rate; about 12 Mb/s provides 50% headroom for an 8 Mb/s payload estimate.
Expressway live trace
Expressway live tracing polls the persistent Network Log. Full SIP bodies depend on the configured logging level; summary records remain useful when only INFO data is available.
Stop and cleanup
The live status control shows connected sources and message count. Stop ends every active source. For CUBE, TranslatorX requests that CCSIP message and transport debugs be disabled before disconnecting and reports cleanup that could not be confirmed.
Optional assistance
AI-assisted trace analysis
AI analysis is optional and does not replace deterministic parsing or protocol review. Start it from a SIP call, a correlated SIP session, or the current filtered message view. Describe the symptom and review the evidence set before sending it to the configured provider.
Providers and models
| Provider | Connection | Model selection |
|---|---|---|
| Ollama | Loopback only; default 127.0.0.1:11434. | Installed local models or a manual model name. |
| Anthropic | Fixed Anthropic API over TLS 1.2+. | Account model list or manual model ID. |
| AWS Bedrock | Regional Bedrock Messages endpoint with a stored API key. | Compatible regional Claude models or manual inference profile. |
| Custom API | User-supplied Anthropic Messages or OpenAI Chat Completions URL. | Discovered models or manual model ID; response model substitution and likely prompt truncation are rejected. |
Provider keys are stored in the operating system credential manager. A provider can be tested, saved, or cleared independently.
For a custom API, select the compatibility mode that matches the endpoint. Remote endpoints require HTTPS; HTTP is allowed only for localhost or a literal loopback address. An API key is optional, and an untrusted HTTPS certificate must be reviewed and explicitly pinned before TranslatorX sends the key or trace evidence.
Privacy controls
Authorization headers and SDP key material are always removed. Cloud analysis anonymizes telephone numbers, IP addresses, and hostnames by default; the user can disable identifier anonymization when approved for the selected account. Local Ollama analysis keeps original identifiers by default.
Evidence and additional context
The initial case includes stable evidence IDs, normalized timestamps, source IDs, and exact line ranges. The model is told that additional raw source data exists and can request literal or regular-expression searches across loaded files, then read exact line ranges before or after a match. It cannot browse arbitrary paths or request data outside the active trace catalog.
Reports, citations, and usage
The report includes probable cause, confidence, technical analysis, findings, alternatives, recommendations, and limitations. Direct Anthropic and supported custom endpoints in Anthropic Messages mode receive TranslatorX’s report schema. Results from AWS Bedrock, OpenAI Chat Completions-compatible endpoints, and Ollama are validated against the same report structure before display. Evidence links open the corresponding message or raw source lines. TranslatorX displays accumulated input, output, cache-read, and cache-write tokens when the provider reports them. Private diagnostics record request progress and provider metadata without writing API keys or full generated report content.
Follow-up questions
After a report completes, use Ask a follow-up to request clarification, supporting evidence, alternatives, or next steps without running another full report. Each answer uses the original provider, model, privacy choice, report, and bounded evidence. The model can request additional searches or exact source ranges when needed, and valid answer citations remain linked to the corresponding evidence.
Follow-ups are retained only while that completed analysis remains open. Revising the analysis, closing the window, or restarting TranslatorX clears the conversation. If the provider or model configuration changes, run a new analysis before asking another question.
Save analysis results
After an analysis completes, Save Results creates a Markdown file or a PDF. Both include the complete report, completed follow-up questions and answers, provenance and usage disclosures, and portable evidence references with internal citation links. PDF additionally includes a static call-flow ladder when one is available; oversized flows use a disclosed representative sample while preserving the complete bounded evidence appendix.
Exports use original identifiers by default, independently of the privacy selected for the model request. Enable Privacy-sanitize phone numbers, IP addresses, and hostnames before saving an artifact intended for sharing. Credentials, authorization values, key material, local source paths, and reversible identifier mappings are excluded in both modes. Treat every export as sensitive diagnostic data and follow the organization’s approved storage, sharing, and retention policy.
Model-produced content is exported as inert text. It cannot create PDF scripts, external actions, attachments, or launch behavior; finding citations use only internal evidence destinations.
Handoff
Export and share
File > Export Trace can export all loaded messages or only the currently displayed result after search, filters, protocol visibility, and routine-traffic controls.
| Format | Use it for | Contents |
|---|---|---|
Readable text (.txt) | Cases, notes, and peer review. | A summary line with normalized time, protocol, direction, source, destination, identifiers, and correlation followed by decoded content. |
TranslatorX trace (.txtrace) | Continuing analysis in TranslatorX. | Source-neutral protocol content plus the structured endpoint, timestamp, decode, and correlation metadata required for re-import. |
| Call Flow SVG | Documents and presentations. | The current signaling and visible media diagram with its lane labels. |
Completed AI analyses are saved separately from Save Results in the analysis window as Markdown or hardened PDF reports with portable evidence references, completed follow-ups, and an optional call-flow ladder.
The trace export formats do not retain the original source path or vendor log wrapper. Device aliases can be exported and imported separately as JSON from the Device Aliases window.
Application settings
Preferences and management windows
| Area | Settings |
|---|---|
| General | System, light, or dark appearance; automatic updates; stable or beta channel with a manual update check; update proxy; fallback GMT offset. |
| Messages | Default routine-traffic exclusions and duplicate SIP detection in Call Flow. |
| Files | Folder scan file class, default protocol families, and the decoded trace-data safety limit. The limit defaults to 8 GiB and accepts whole-GiB values; a large load explains its estimate and asks before raising the saved limit. |
| Connections | Links to Profile Manager, SSH Jump Hosts, and Proxy Profiles. |
| AI | Provider, endpoint, region, model, credential storage, connection test, privacy defaults, save, and clear. |
The More menu also opens Profile Manager, SSH Jump Hosts, Proxy Profiles, Device Aliases, and Source Times. Device aliases are shared by the main workspace and every Call Flow window.
Release channels
Software updates
Automatic update checks are enabled by default and can be disabled in Preferences. Select Stable for public production releases or Beta for prerelease builds. The channel can be changed in Preferences or Software Update; changing it in Software Update saves the choice and immediately checks the newly selected channel. Update checks and downloads use the selected system, direct, or saved HTTP or SOCKS5 proxy route. Updates are downloaded only from the configured TranslatorX release feed and are verified with the application updater signature.
Manual Check for Updates is available next to the channel and proxy settings in Preferences, in the TranslatorX application menu on macOS, and in the Help menu on Windows. Platform installer signatures remain separate from the updater signature.
Background activity
Event Log
Open View > Event Log to review notices and warnings that should not occupy the main message workspace. Entries include skipped import sources, partial remote collections, inferred clock behavior, live-trace failures, debug cleanup warnings, and other background operations.
An Event Log warning does not necessarily mean the complete operation failed. Multi-device operations can retain successful results while recording a separate error for an unavailable target.
Compatibility
Supported data
| Source | Common inputs | Available detail |
|---|---|---|
| Unified CM | SDL/SDI, calllogs, embedded or standalone CDR/CMR. | Full decoded signaling when present; structured summaries for calllogs and records. |
| CUBE / IOS gateways | VoIP trace output, debug ccsip messages, SIP transport/socket debug, Q.931 debug. | SIP/SDP, inferred transport endpoints, ISDN messages, and call correlation. |
| Expressway / VCS | Persistent Network Log and diagnostic bundles in current and older layouts. | SIP, H.323, RAS, full DEBUG messages, and limited INFO summaries. |
| Clients and endpoints | Webex App, Webex Calling, Jabber/CSF, MPP, phone problem reports, and supported embedded SIP formats. | Product-specific signaling and device identity when present. |
| Other signaling | CUSP, BroadWorks, and supported PCAP files. | Decoded messages supported by each parser. |
| Containers | Text, gzip, ZIP, TAR, TAR.GZ, TGZ, nested archives, directories, clipboard text, and .txtrace. | All supported entries discovered within configured limits. |
Protocol coverage includes SIP/SDP, SCCP, Q.931/Q.SIG, MGCP, MGCP backhaul, H.225, RAS, and H.245. A source can be imported only to the level of detail it actually recorded.
Data protection
Security and privacy behavior
- Local file parsing, filtering, call correlation, call flow, and export do not require a cloud service.
- Saved secrets use the operating system credential manager rather than the profile or settings file.
- Supported HTTPS API connections require TLS 1.2 or newer, do not follow redirects, and use platform trust or an explicitly approved certificate pin.
- SSH uses reviewed host keys, supports separate jump-host credentials, and does not automatically trust an unknown key.
- Cloud AI analysis is user-initiated, strips credential material, and anonymizes identifiers by default. Local Ollama is restricted to loopback addresses.
- Application updates require the TranslatorX updater signature. macOS and Windows installers also use their platform signing systems.
Software Bill of Materials: TranslatorX publishes a platform-union inventory of the desktop application’s Rust dependencies and production interface dependencies. Each release retains its own CycloneDX 1.5 and SPDX 2.3 inventories with SHA-256 checksums in the release SBOM archive.
These controls do not replace organizational policy. Trace and diagnostic files can still contain sensitive customer, user, network, and authentication data that must be handled appropriately.
Navigation
Keyboard, menus, and windows
| Action | Shortcut |
|---|---|
| Open files | Cmd/Ctrl + O |
| Open folder | Cmd/Ctrl + Shift + O |
| Import from clipboard | Cmd/Ctrl + Shift + V |
| Message Filters | Cmd/Ctrl + F |
| New filter | Cmd/Ctrl + N |
| Call List | Cmd/Ctrl + Shift + C |
| Preferences | Cmd/Ctrl + , |
| Close active window | Cmd/Ctrl + W |
Call Flow, Call List, Session Inspector, filters, source files, CDR detail, and management tools use separate native windows where appropriate. Closing the active secondary window does not clear the trace session. macOS keeps application actions in the TranslatorX menu; Windows uses the conventional File, View, Filter, Calls, and Help menus rather than an application-named menu.
No documentation sections match that search.